
Mobile App Analytics Tools: What They Cost and What They Catch
Six mobile app analytics and crash-reporting tools compared by pricing, crash detection, performance monitoring and platform support. Firebase Crashlytics, Sentry, Bugsnag, New Relic, Datadog and Luciq.
- Written by
- Yuvan Sundrani
- Read time
- 15 min read
- Published

Mobile app analytics tools monitor a production application to report crashes, errors, performance degradation and user behavior across devices and OS versions. They answer the question that no pre-release test suite can: what is actually happening to real users right now? That makes them the production-side complement to the mobile app testing teams do before every release.
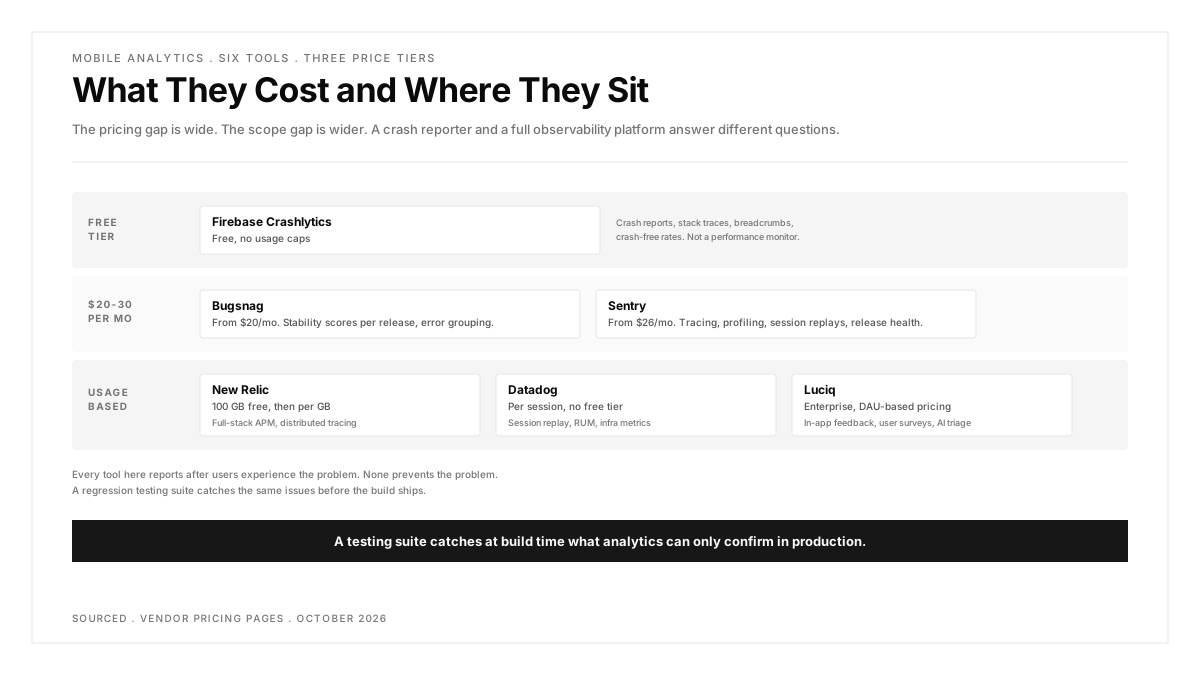
The pricing gap in this category is wide. Firebase Crashlytics is free with no usage caps on crash reporting. Sentry starts at $26 per month. Datadog bills per session. The difference is not just cost; it reflects fundamentally different scopes. A crash reporter tells you the app crashed. A full observability platform tells you the crash happened during a checkout flow, on a Samsung Galaxy A14 running Android 13, on a 3G connection, 4 seconds into the session.
This guide covers six tools, what each one costs, what it catches, and which teams it fits.
Key Takeaways
- Firebase Crashlytics is free with no event caps, making it the default starting point for mobile teams with no crash-reporting budget.
- Sentry and Bugsnag both offer free tiers for small teams and scale into paid plans as error volume grows. Sentry starts at $26 per month; Bugsnag starts at $20 per month.
- Datadog and New Relic are full observability platforms that include mobile monitoring as one product among many. Their pricing is usage-based and harder to predict for mobile-only teams.
- Crash reporting and performance monitoring solve different problems. A crash report tells you the app stopped. Performance monitoring tells you the app was slow for 12 seconds before it stopped.
- The testing gap matters: analytics tools report problems after users experience them. Catching issues before release requires a separate testing layer, and the two work best when connected.
How do mobile analytics tools compare on pricing?
| Tool | Free Tier | Paid Starting Price | Pricing Model | Mobile Platforms |
|---|---|---|---|---|
| Firebase Crashlytics | Unlimited crash reporting | No paid tier for Crashlytics specifically | Free (part of Firebase) | iOS, Android, Flutter, Unity, C++ |
| Sentry | 5K errors, 1 user | $26/mo (Team plan, annual) | Per error volume | iOS, Android, React Native, Flutter, Unity |
| Bugsnag | 7.5K events, 1 user | $20/mo (Select plan) | Per event volume | iOS, Android, React Native, Flutter, Unity, Unreal |
| New Relic | 100 GB/mo data ingest, 1 user | Usage-based ($0.40/GB beyond free) | Per data volume | iOS, Android, React Native, Flutter, .NET MAUI |
| Datadog | 14-day trial | Usage-based (per session) | Per session volume | iOS, Android, React Native, Flutter, Kotlin Multiplatform |
| Luciq (formerly Instabug) | Demo only | Contact sales (DAU-based) | Per daily active user | iOS, Android, React Native, Flutter, Xamarin |
Pricing verified from each vendor's pricing page as of October 2026.
Firebase Crashlytics
What it costs: Free. Crashlytics carries no usage limits and no paid tier. It is part of the broader Firebase platform, where other services (Cloud Functions, Firestore, Hosting) have free tiers with paid overages, but crash reporting itself is unlimited on both the Spark (free) and Blaze (pay-as-you-go) plans.
What it catches:
- Real-time crash reports with full stack traces, grouped by root cause
- Non-fatal errors and handled exceptions when explicitly logged
- Breadcrumb logs showing the sequence of events leading to a crash
- Crash-free session rate and crash-free user rate, filterable by app version, device and OS
- Integration with Google Analytics for correlating crashes with user journeys
What it does not catch:
Crashlytics is a crash reporter, not a performance monitor or an error tracker with alerting workflows. It tells you the app crashed and why, but not that the app was slow, that a specific API call timed out, or that frame rendering dropped below 60 fps. Teams that need both crash data and live performance metrics alongside their testing in production strategy will need to combine Crashlytics with Firebase Performance Monitoring or a separate tool. Firebase offers a separate Performance Monitoring product (also free) for latency and network metrics, but the two are separate dashboards rather than a unified view.
Best for: Teams on a budget that need crash visibility without committing to a monthly bill. The integration with Firebase's other services (Remote Config, A/B Testing, App Distribution) makes it the natural choice for teams already in the Firebase ecosystem.
Sentry
What it costs: Free for one user with 5,000 errors per month. The Team plan starts at $26 per month (billed annually) and includes 50,000 errors, unlimited users, and integrations with third-party tools. The Business plan starts at $80 per month and adds advanced quota management and SAML/SCIM support. Overages beyond included quotas are billed at pay-as-you-go rates per error.
What it catches:
- Error monitoring with full stack traces, contextual data and automatic grouping
- Distributed tracing across mobile, frontend and backend services
- Session replays showing exactly what the user saw before the error
- Release health tracking with crash-free rate per release
- Performance monitoring for transactions, queries and API calls
- Profiling (UI and continuous) for identifying slow code paths
What it does not catch:
Sentry is an error and performance monitoring tool, not a product analytics platform. It tells you what went wrong, but not what users did before it went wrong in the behavioral sense (funnels, retention, engagement). For product analytics, teams pair Sentry with a tool like Mixpanel or Amplitude.
Best for: Teams that want error monitoring, tracing and performance in one platform with a clear per-error pricing model. The free tier is generous enough for early-stage products, and the Team plan covers most mid-size apps.
Bugsnag
What it costs: Free for one user with 7,500 events and 1 million performance spans per month. The Select plan starts at $20 per month with 50,000 events and unlimited users. The Preferred plan starts at $33 per month with 100,000 events and deeper diagnostic features. Enterprise pricing is custom.
What it catches:
- Error monitoring with automatic grouping, stack traces and release correlation
- Performance monitoring measuring app starts, screen loads and web vitals
- Stability scores per release, so teams can compare the quality of successive builds
- Breadcrumbs capturing the user actions, network requests and console logs that preceded the error
- Feature flags integration for correlating errors with specific feature flag states
What it does not catch:
Bugsnag focuses on stability and errors. It does not offer distributed tracing, session replays, or the kind of deep performance profiling Sentry and Datadog provide. Teams needing trace-level visibility across multiple services will find the scope narrower.
Best for: Mobile teams that want straightforward crash and error monitoring with a lower entry price than Sentry. The stability score per release is a particularly useful metric for teams shipping frequently.
New Relic
What it costs: The free tier includes 100 GB of data ingest per month, one full platform user, and access to over 50 capabilities including mobile monitoring. Beyond the free tier, additional data costs $0.40 per GB. Paid editions (Standard, Pro, Enterprise) add more users and advanced features at custom pricing.
What it catches:
- Mobile crashes with stack traces and device context
- HTTP request monitoring showing response times, error rates and throughput per endpoint
- Interaction traces measuring how long each screen takes to render and respond
- MobileHandledException events for tracking non-fatal errors
- Distributed tracing across mobile, web and backend services
- Alerting and dashboards that can correlate mobile metrics with infrastructure and APM data
What it does not catch:
New Relic is a full observability platform. The breadth is its strength and its complexity. Configuring mobile monitoring is straightforward, but getting value from the cross-stack correlation features requires instrumenting the backend as well. Teams looking for a self-contained mobile crash reporter may find the platform larger than they need.
Best for: Teams already using New Relic for backend or infrastructure monitoring who want mobile visibility in the same platform. The 100 GB free tier is generous enough to evaluate whether the platform's breadth justifies its learning curve.
Datadog
What it costs: Datadog's mobile Real User Monitoring is priced per session on a usage-based model. There is no permanent free tier; a 14-day trial is available. Pricing scales with the number of sessions and the products enabled (RUM, Session Replay, Mobile App Testing). Exact rates depend on commitment and volume. The current pricing is published on the Datadog pricing page.
What it catches:
- Real User Monitoring capturing every user session with screen views, actions, errors and resources
- Session Replay showing a visual reconstruction of the user's experience
- Error tracking with automatic grouping and stack trace symbolication
- Performance metrics covering app launch time, frame rate and resource loading
- Mobile App Testing for synthetic testing of mobile applications
- Correlation with Datadog's full infrastructure, APM and log monitoring stack
What it does not catch:
Datadog captures broad telemetry but the cost at scale can be difficult to predict for teams with high session volumes. The platform is designed for organizations already invested in the Datadog ecosystem. A mobile-only team may find the minimum spend higher than dedicated crash-reporting tools.
Best for: Engineering organizations already using Datadog for infrastructure and APM that want mobile observability correlated with backend metrics in one dashboard.
Luciq (formerly Instabug)
What it costs: Luciq (the company formerly known as Instabug) offers enterprise pricing only, based on daily active users and member seats. There is no self-serve pricing or public price list. A demo can be requested through the Luciq pricing page. The platform is SOC 2 Type II certified with regional data hosting options.
What it catches:
- Crash reporting and error monitoring with device, OS and network context
- Performance monitoring covering app launches, screen loads and network calls
- In-app bug reporting with annotated screenshots and screen recordings submitted by users and testers
- User surveys and in-app feedback collection
- AI-powered root cause analysis (branded as "Companion") and automated fix suggestions ("Autopilot")
- Session-level diagnostics combining crashes, performance data and user feedback in a single timeline
What it does not catch:
Luciq does not offer distributed tracing across backend services. Its scope is client-side mobile observability, not full-stack APM. Teams needing to trace a mobile error through to a specific backend service call will need a separate tool for that portion.
Best for: Large mobile teams that want a single platform combining crash reporting, performance monitoring, in-app feedback and user surveys. The DAU-based pricing model is simpler to predict than per-event or per-session models at high scale.
How to choose between these tools
The decision depends on two things: what you already have and what you need beyond crash reporting.
If you have nothing and need crash visibility today: Start with Firebase Crashlytics. It is free, the SDK installs in minutes, and it covers the most urgent need: knowing when the app crashes and why.
If you need error monitoring with performance and tracing: Sentry or Bugsnag. Both offer free tiers, both scale into reasonable paid plans, and both have strong mobile SDKs. Sentry has the broader feature set (tracing, profiling, session replays). Bugsnag has the simpler scope and lower starting price.
If you already run Datadog or New Relic for backend monitoring: Add the mobile SDK to the platform you already use. The value of seeing a mobile error correlated with the backend trace that caused it is higher than the value of a standalone mobile crash reporter, even if the standalone tool is better at crash grouping.
If you need in-app feedback collection alongside crash data: Luciq (formerly Instabug) is the only tool in this list that combines bug reporting, user surveys and crash analytics in one platform.
The gap between analytics and testing
Analytics tools report what happened after users experienced it. A crash-free rate that drops from 99.6 to 98.9 over a week tells you something is wrong, but the damage is already done. A regression testing suite that runs before every release would have caught the change that caused the drop.
Testing before release catches the issues analytics would eventually surface, before real users hit them. The strongest setup is both: a test suite that validates behavior before every build ships, and analytics that confirms the build performs as expected in production.
Mobile app performance testing covers the pre-release side of that equation, validating speed, memory and stability on real devices before the build reaches the store.
FAQs
Is Firebase Crashlytics really free?
Yes. Firebase Crashlytics carries no usage caps and no paid tier for crash reporting specifically. It is listed as "No-cost" on both the Spark (free) and Blaze (pay-as-you-go) Firebase plans. Other Firebase products have usage limits and paid overages, but Crashlytics itself is unlimited. This has been the case since Google acquired Fabric (the original Crashlytics parent) and folded it into Firebase.
What is the difference between crash reporting and APM?
Crash reporting captures the moment the application stopped working: the stack trace, the device state, and the sequence of events leading to the crash. APM (Application Performance Monitoring) captures ongoing behavior: response times, frame rates, memory usage, network latency. Crash reporting is a subset of APM. Tools like Firebase Crashlytics focus on the subset. Tools like Datadog and New Relic cover the full scope.
Can I use multiple analytics tools at the same time?
Yes, and many teams do. A common pattern is Firebase Crashlytics for free crash reporting plus Sentry for deeper error tracking and tracing. Some teams add a third layer for compatibility testing across device and OS combinations, since analytics data often reveals that crashes concentrate on specific hardware. The tradeoff is SDK overhead: each analytics SDK adds to the app's binary size, startup time and battery consumption. Two SDKs are usually manageable. Four is usually too many.
How much data does a mobile analytics SDK collect?
The volume depends on configuration. At default settings, most SDKs send crash reports (small, infrequent), performance samples (periodic, moderate size), and session metadata (small, every session). Testing the data consumption on real devices rather than emulators gives more accurate numbers because emulators do not replicate battery or bandwidth constraints. A typical app sends between 1 MB and 10 MB of analytics data per user per month. SDKs like New Relic and Datadog that capture full session traces will sit at the higher end.
Does Crashlytics work with cross-platform frameworks?
Firebase Crashlytics supports iOS, Android, Flutter, Unity and C++ applications. React Native is supported through community-maintained wrappers. Sentry and Bugsnag have official SDKs for React Native, Flutter, Unity and Unreal Engine in addition to the native platforms.
What replaced Instabug?
Instabug rebranded to Luciq in 2026. The product at luciq.ai is the continuation of Instabug's mobile observability platform, with the same core features (crash reporting, performance monitoring, in-app feedback) under a new name and updated branding. Existing Instabug customers were migrated to the Luciq platform.